
Why sound?
My day starts with singing in the shower and ends with listening to meditation soundtracks. Music excites me. It is one thing I look forward to in the day. Quality of sound matters to me because without it, my day is dull. And this is true for millions (if not billions) of people. Sound is the key to happiness, to calmness, to excitement, to peace. Sound is the key to life. That’s why it is so important to harness it, and in the right way. In a way that enables people to understand their surroundings and truly immerse in them. The simplest way we can do this is through the music we listen to. Music is an integral way to define how sound is experienced. I want to drive this powerful experience by understanding how music and sound affect our community. Let me take you through this journey towards harnessing it!
Play the audio below to hear the difference between what you just read and sound!
This is an on-going project, and I am just getting started. To begin with, I have used Spotify API to get global streaming data using the RESTful API. Spotify not only provides a gateway into listening trends for billions of users around the world but helps us understand music through its music intelligence data (provided by Spotify-owned The Echo Nest).
Accessing Spotify API
Introduction to Spotify API, its endpoints, and necessary authentication. I’ve used Python to access data using the Web API interface.

Eminem’s album trends & Music To Be Murdered By
How has Eminem’s discography changed over the years? Is his latest as negative as the controversies surrounding it? Let’s check it out!
Early Insights
Global Listening Trends
I used Spotify Charts API to acquire global streaming data for Top 200 songs over the last 2 years from 1/1/2017 to 12/22/2019. Here are a few insights from that.
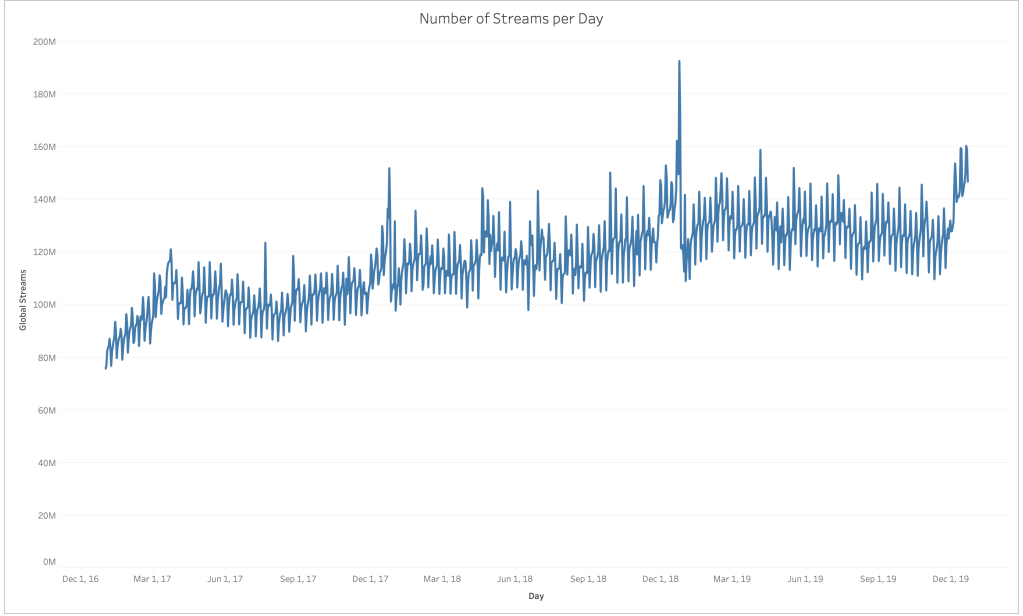
This chart shows the total daily number of streams on Spotify for Top 200 Global songs. As you can see, there is a visible seasonality in the graph.
There are 2 very peculiar spikes in the number of streams though. Let’s see what days are these!
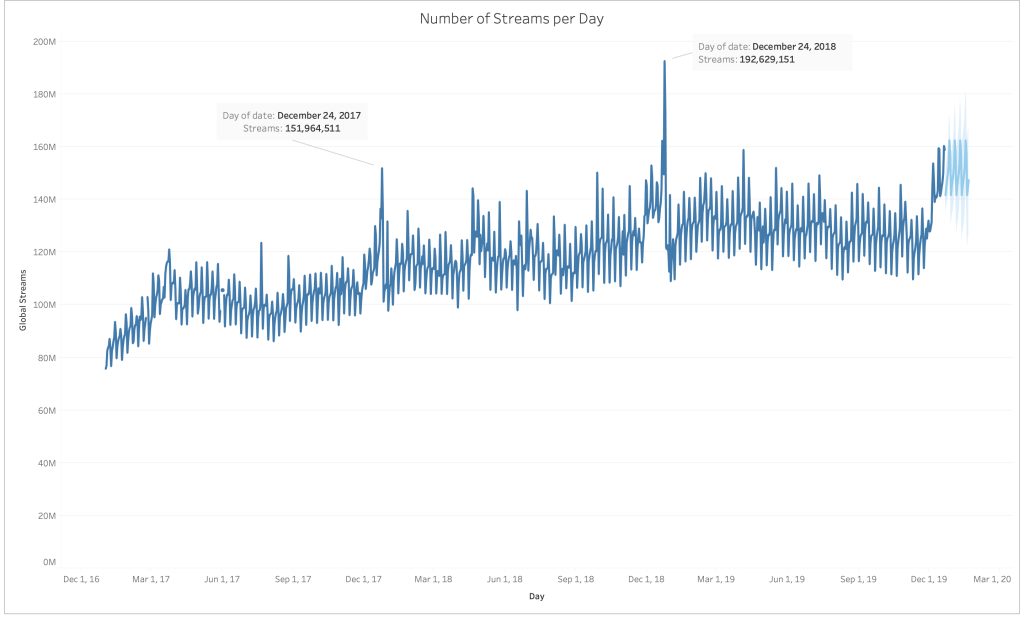
I labelled the days with the uptick in number of streams. And voilà! The local maxima are at December 24 every year. I acquired the data on 22nd December 2019 so I do not have the information for 24th December 2019. It is pretty clear, though, that there is an upward climb in the number of streams around the holiday season!
Tableau’s automated forecast shows a steady stream over the month which is hardly accurate. I might plug this into RStudio and make a better model to forecast the number of streams!
Why are the number of streams increasing?
It seems a bit straightforward. Spotify is growing. Spotify has been acquiring an increasing number of users and launching to newer countries every year. That seems to be the primary reason for increase in streams.
Why are there two spikes in number of streams?
Let’s take a look at the audio feature analysis and figure out!
Audio Feature Trends over Time
I plotted audio features like Energy, Danceability, Valence(Positivity), and Acousticness for the Global Top 200 songs over the last 2 years.

Like before, even in this chart we can see two peaks occurring. Let’s check the dates on these!

The average Danceability and Energy of the songs go down around 20th of December every year. That makes sense as we start listening to calmer songs. At around the same time, average Valence goes up. This is an effect of happier and positive Christmas jingles!
These Christmas songs are also more vocal and so the average Acousticness shoots up too!
Although the energy drops around the holiday, it soon gains a high on 31st December every year getting people readied up for the exciting year ahead! Music impacts us in a lot of ways, some more intricately than New Years and holidays.
Still don’t think sound affects us?
Stay tuned and I will soon have enough evidence to convince you!
More to come!
