Eminem’s album trends and Music To Be Murdered By (2020)

From asking for a change in gun laws to calling out shootings at an Ariana Grande concert, Eminem’s lyrics in Music To Be Murdered By have been surrounded by controversies since the day it launched last week. Yet, this is not unusual for anyone familiar with Eminem’s work. He is popular for lyrics that do not conform to political correctness and swears that will make your mom upset.

Just a week later and Music To Be Murdered By has topped the Billboard 200 making Eminem the only artist having 10 studio albums that topped the chart. The times have changed since Em first launched his studio album. Let’s see if his music has changed too!

In this one, I have covered the trends for Eminem’s 10 studio albums. This includes audio analysis, changing feature trends with albums, and a look at the positivity of Em’s albums.

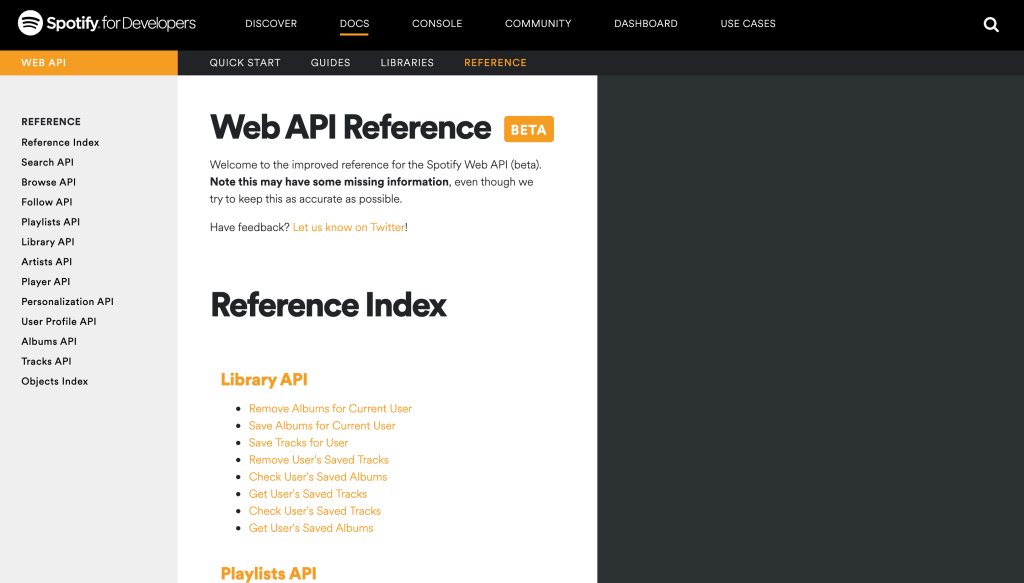
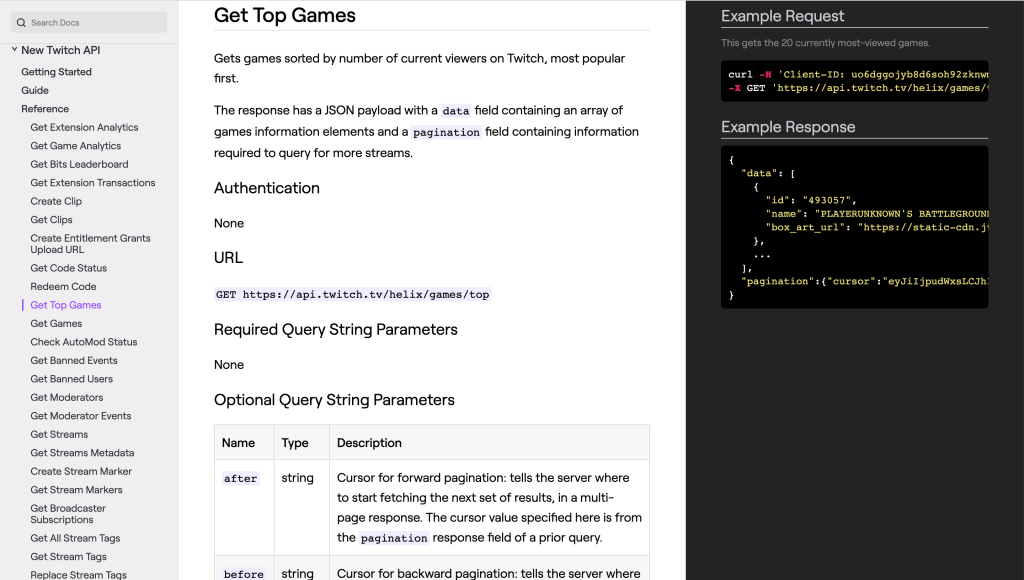
I have primarily used data from Spotify’s API using multiple endpoints for albums and tracks. I supplemented the data with stats from Billboard and calculations from this post.

Trends in Positivity for all albums

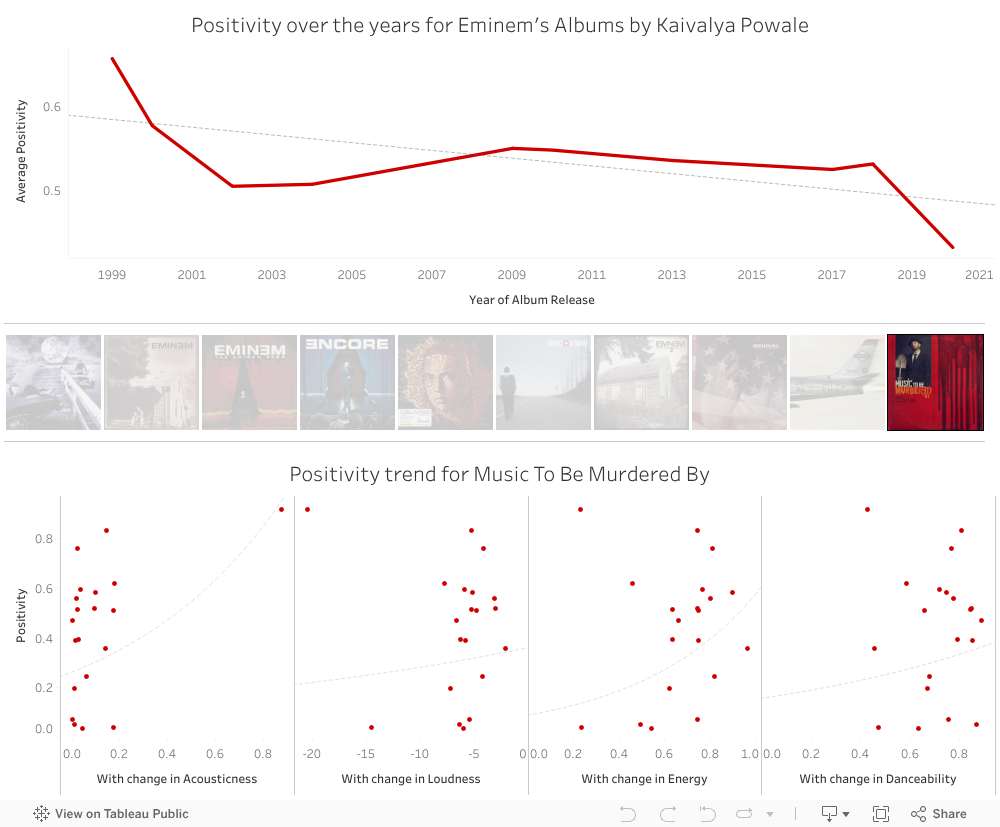
I created a dashboard that shows the average Positivity of Eminem’s albums over the years. This feature was obtained from Spotify’s Web API endpoint. Spotify calls this metric Valence which reflects on positivity (hence I have called it that to simplify things). Here’s how Spotify has defined this metric
“A measure from 0.0 to 1.0 describing the musical positiveness conveyed by a track. Tracks with high valence sound more positive (e.g. happy, cheerful, euphoric), while tracks with low valence sound more negative (e.g. sad, depressed, angry).”

Every point on the plot represents one song in the album.

Click to see Tableau Viz

It is clear that over the years Em’s songs are perceived to be more and more negative. Music To Be Murdered By is by far the most negatively perceived album according to the audio analysis. And it seems so too in reality. With songs like ‘Darkness’ and ‘In Too Deep’, Eminem has addressed a lot of sadness around in this one.

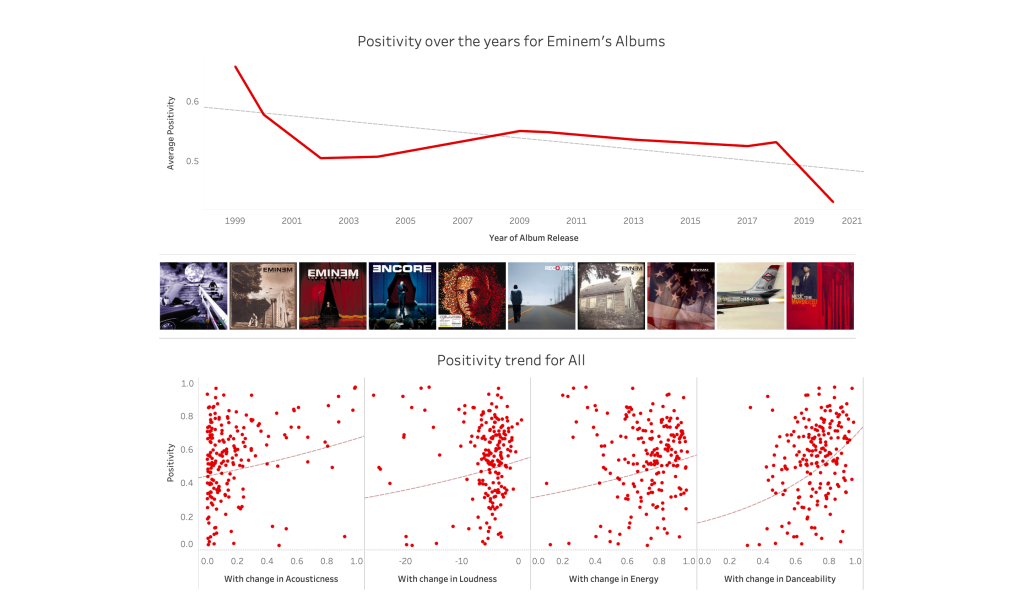
The chart above tells us that, in general, the Positivity increases with an increase in Acousticness, Loudness, Energy, and Danceability of the songs. That makes sense as more acoustic and danceable songs are the effect of pop collaborations whereas louder and more energetic songs tend to sound happier.

Here’s how the Positivity trends with respect to Speechiness of the songs i.e. with an increase in words, the songs are more positive. That sounds unusual and pretty much unlike Em!

This is not true for all albums though. Whereas Positivity increases with Marshall’s words in his latest, for albums like Relapse the positivity actually decreases with more words.

It still seems highly unusual for Eminem’s words to be perceived more positively. Let’s see how have those words changed over time!

Words and Song Durations

Over time, the album duration is going down which shows that Eminem is making shorter albums. That’s for sure with just 13 songs in Kamikaze as compared to an average of 19 songs per album for others.

When we look at song duration, it tells the same story. The song duration has gone down over the years. This is a phenomenon affecting the industry as an influence of pop culture.
It is worth noting that the song duration bumped around Marshall Mathers LP 2. This album was Em’s comeback album and featured longer songs like ‘Rap God’ and included a couple of skits pulling up the average duration.

Another possible explanation is that the song duration is decreasing as Eminem is spittin’ out words faster and faster with every release. This is shown the likes of ‘Rap God’ in MMLP2 and now in ‘Godzilla’ with Em making history by packing a whopping 7.23 words per second!

Eminem swears like he wants to upset your mom. His work is widely popular for being laden with swear words, controversial, offensive, and misogynistic lyrics. Let’s see how the swear words in his songs have changed over time!

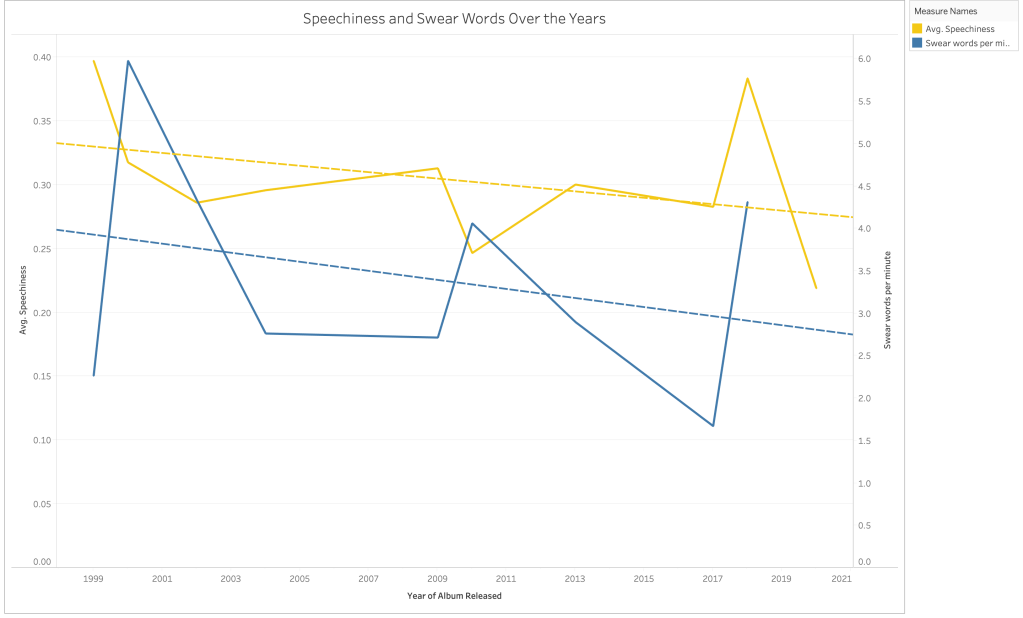
Eminem’s most controversial work has been during the early 2000s. This chart is a proof of that. The number of swear words used has gone down over time except for the uptick in Kamikaze. Over the years, he has calmed down and made a few amends; like forgiving his mom.

Speechiness shows that the ratio of words to music has also gown down over the years. As both the trend lines suggest, Eminem is using lesser words, more music, and definitely lesser swear words. Would that make your mom happy?

Features over the years

A major part of Spotify’s API is the audio feature analysis by its music intelligence company The Echo Nest. This data is calculated through its proprietary algorithm and not much is shared about how the features are calculated.

These features give a great overview of a song, album, or playlist though. It is worthwhile to take a look at them. So, I went ahead and created a simple dashboard for you to explore all the features firsthand! Take a look.

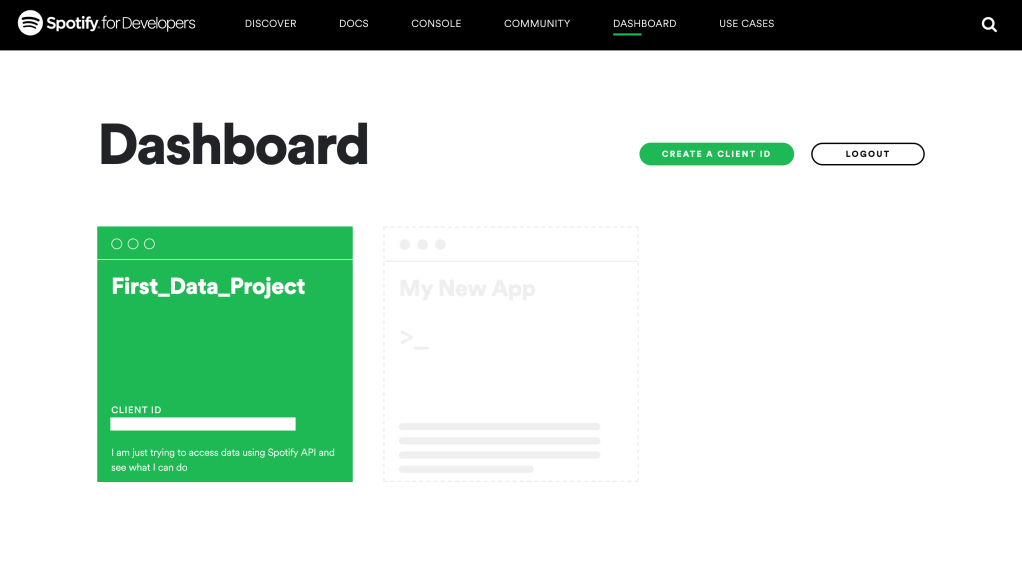
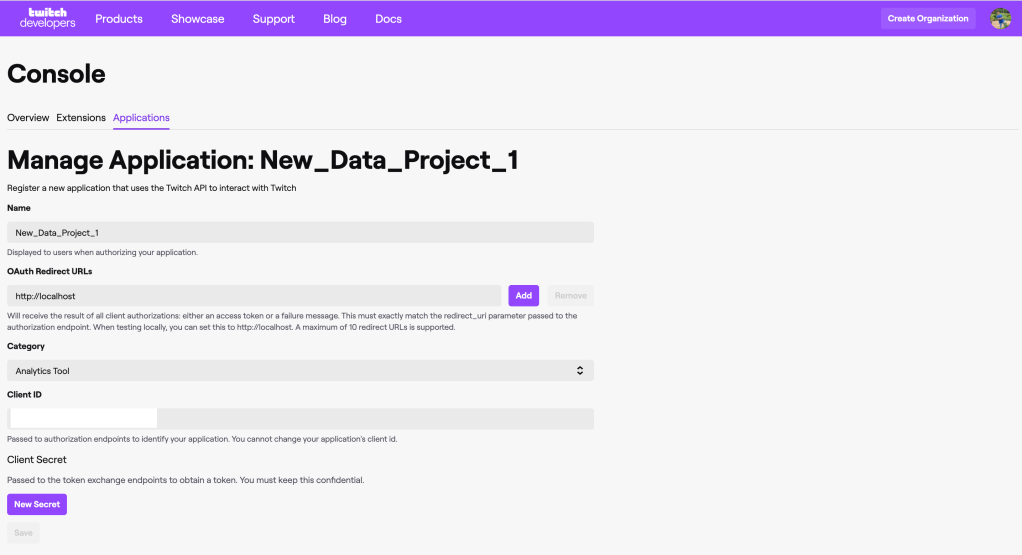
That’s it for this one! I will be sharing the code to acquire this data soon. Until then, learn how to access Spotify’s API or check out my GitHub to see if I have uploaded the code to my repo. Thanks for reading!

Update 05/11/2020: You can download the Python notebook and data directly from here. The notebook has all the guidelines for the project.
You can also go to my GitHub for more instructions. You can return here to look at visualizations!

How to access Spotify API

Spotify’s Web API is a RESTful API and gives you access to music artists, tracks, albums, public playlists, and user-specific data. The data access depends on the authentication you acquire.

So, I am going to write about acquiring the Authentication and Validation before I get to my project or analysis.

This process is quite similar to Accessing Twitch API or any other RESTful API for that matter.

1. Create an account with Soptify for Developers at https://developer.spotify.com/. Go to your dashboard and register a new app.
2. Enter basic information and the purpose of your app. Once you do this you will get your Client ID and Client Secret.
3. Check out Spotify’s Web API documentation to get a complete understanding of all the authentication flows and endpoints. Or stay tuned as I am going to cover it in my upcoming pieces.
I personally refer to the API Reference. It’s quite simple to understand and gives a comprehensive view of everything you need to get started.
4. Authenticating ourself to get the Access Token

I am using the Client Credentials flow because we do not need any user’s data as of now. Spotify’s Access Token’s last for 3600 seconds i.e. 1 hour.

import pandas as pd
import requests
import json
from pandas.io.json import json_normalize
import time
import base64

To authenticate, you need to encode your Client ID and Client Secret in your endpoint request. I am going to write a function that takes care of encoding and the request.

# Defining base64 encoding of the IDs
def base64_encode(client_id,client_secret):
encodedData = base64.b64encode(bytes(f"{client_id}:{client_secret}", "ISO-8859-1")).decode("ascii")
authorization_header_string = f"{encodedData}"
return(authorization_header_string)

You can call the function and pass the IDs as arguments but hold on. We can write another function directly for the request and call the base64-encode within that.

def accesstoken(client_id, client_secret):
header_string= base64_encode(client_id,client_secret)
headers = {
'Authorization': 'Basic '+header_string,
}
data = {
'grant_type': 'client_credentials'
}
response = requests.post('https://accounts.spotify.com/api/token', headers=headers, data=data)
access_token = json.loads(response.text)
access_token = access_token['access_token']
return(access_token)
access_token = accesstoken('your Client ID','your Client Secret')
access_token
"""
Sample response is
{'access_token': 'BQA5Zu1uNhJbKpr3tBcWRseAy-qfwwPXMjJQEvXyqKdy0Y1XaQvsC8HTE7qYuI1e_fMUVuwLltADeA-QuNc', 'token_type': 'Bearer', 'expires_in': 3600, 'scope': ''}
And using this function you don't need to worry about extracting the access_token from the JSON response.
The accesstoken function will return a string like this
'BQA5Zu1uNhJbKpr3tBcWRseAy-qfwwPXMjJQEvXyqKdy0Y1XaQvsC8HTE7qYuI1e_fMUVuwLltADeA-QuNc'
"""

Now you have your access token. You can directly use the variable access_token in all other endpoint requests.
A sample request looks like this

That’s all for this one. I am going to be writing more and will present some examples of the API. Stay tuned.

Twitch Live Dashboard – Accessing Twitch API

What is Twitch?

Twitch is the world’s largest live streaming platform focused primarily towards gamers and e-sports. With an average of 15 million unique daily viewers, the world spent a whopping 560 billion minutes watching content on Twitch in 2018. [1]
We decided to see take a look at the Top Games and Top Streamers being watched on Twitch. This was made easy by Twitch as they provide a ton of developers tools including relevant data accessible through Twitch API.

Here’s a pretty simple dashboard we created on Tableau

You can take a look at an interactive version published on my Tableau Public profile. This dashboard shows Top Games streamed and Top Streamers based on the number of Viewers. If you select a game then you can see the Top Streamers for a particular game. Tableau Public only takes data extracts so this public dashboard is not pulling live data from Twitch.

Link to the GitHub repo: https://github.com/kaivalyapowale/Twitch-Dashboard/

Team project by Vardayini Sharma, Maddhujeet Chandra, and Kaivalya Powale.

Tutorial

I have outlined a complete tutorial from accessing Twitch API using a python script to the final Tableau Dashboard design.
(For our real-time dashboard we used an Amazon Web Services EC2 instance to run our python script and AWS RDS to store the live data. I am not going over those in this tutorial. Instead, I am using a locally stored csv file which my python script updates automatically every 60 seconds.)

1. Create a Twitch Developer account at https://dev.twitch.tv/. Go to your Dashboard and ‘Register a New Application’. You will need this to get your Client ID and Client Secret.
Use localhost as redirect link. You will get your Client ID and Client Secret on this page.
2. Check out the Twitch API documentation to fully understand the API calls, what data it offers, and what authentication it requires for the data you need.
Twitch API has a lot of available requests. Use: https://dev.twitch.tv/docs/api/reference
3. Authenticating ourselves to getting the Access Token.

I used a Jupyter Notebook to write my python script. You can use whatever you are comfortable with. For beginners, I’d recommend Jupyter Notebooks. (do some research to see what best fits your skill level)

First begin by importing the necessary libraries

import json
import requests
import pandas as pd
from pandas.io.json import json_normalize
import time
import threading

Now move onto authentication to get the access token

#Client ID: –***—
#Client Secret: —***—
#Client ID and Client Secret are sensititve and you should not share them
client_id= <yourclientid>
client_secret= <yourclientsecret>
#Request for the access code using requests library
#I have chosen this method of authentication with my goal in mind
access_code = requests.post('https://id.twitch.tv/oauth2/token?client_id=&#39;+str(client_id)+'&client_secret='+str(client_secret)+'&grant_type=client_credentials')
#access token response is a JSON-encoded app access token
access_token = json.loads(access_code.text)
access_token = access_token['access_token']
#Sample response is
"""
{
"access_token": "prau3ol6mg5glgek8m89ec2s9q5i3i",
"refresh_token": "",
"expires_in": 3600,
"scope": [],
"token_type": "bearer"
}
"""
4. We need two types of API calls for this dashboard Get Top Games and Get Streams.

We will first access the API for Top 100 Games by number of viewers. Using the Game IDs for these games, we will get Stream data for them.

# Getting data for Top 100 Games by number of viewers
# Default response is for 20 games so you will have to set the parameter 'first to 100'
headers = {
'Authorization' : 'Bearer '+str(access_token),
}
games_response = requests.get('https://api.twitch.tv/helix/games/top?first=100&#39;, headers=headers)
# The response will be a JSON which will include the response data and the pagination cursor
# We need to extract the data from the JSON and convert it into a pandas dataframe
games_response_json = json.loads(games_response.text)
topgames_data = games_response_json['data']
# Converting to a pandas dataframe
topgames_df = pd.DataFrame.from_dict(json_normalize(topgames_data), orient='columns')
# See the first few lines. The response includes id, name, and box art url for the game
topgames_df.head()

To get the Top Streams for these games we will have to pass the game IDs as strings in the API call one at a time. For this, we need to create a FOR loop to get data for all the Games.

# I am getting only the top 25 streamers for the first game
headers = {
'Authorization' : 'Bearer '+str(access_token),
}
topstreamsforgame_response = requests.get('https://api.twitch.tv/helix/streams?game_id=&#39;+str(topgames_df['id'][0])+'&first=25', headers=headers)
# Load the JSON
topstreamsforgame_response_json = json.loads(topstreamsforgame_response.text)
# Extracting data from the JSON
topstreamsforgame_data = topstreamsforgame_response_json['data']
# Converting into a DataFrame
topstreamsforgame_df = pd.DataFrame.from_dict(json_normalize(topstreamsforgame_data), orient='columns')
# FOR loop to get top 25 streamers for rest of the games in our list
# To keep the dashboard lightweight and relevant, I am using only the Top 20 Games and Top 25 Streamers per game
for i in range(1,19) :
headers = {
'Authorization' : 'Bearer '+str(access_token),
}
topstreamsforgame_response = requests.get('https://api.twitch.tv/helix/streams?game_id=&#39;+str(topgames_df['id'][i])+'&first=25', headers=headers)
topstreamsforgame_response_json = json.loads(topstreamsforgame_response.text)
topstreamsforgame_data = topstreamsforgame_response_json['data']
topstreamsforgame_df_temp = pd.DataFrame.from_dict(json_normalize(topstreamsforgame_data), orient='columns')
frames = [topstreamsforgame_df, topstreamsforgame_df_temp]
topstreamsforgame_df = pd.concat(frames, ignore_index=True)
# Look at the data we retrieved
topstreamsforgame_df.info()

Now, for the final trick, we will define a function which will enclose all our code and put a Timer so that it pulls the data every 60 seconds.

def twitch():
threading.Timer(60.0, twitch).start()
# Top Games
headers = {
'Authorization' : 'Bearer '+str(access_token),
}
games_response = requests.get('https://api.twitch.tv/helix/games/top?first=100&#39;, headers=headers)
games_response_json = json.loads(games_response.text)
topgames_data = games_response_json['data']
topgames_df = pd.DataFrame.from_dict(json_normalize(topgames_data), orient='columns')
# Top Streamers
headers = {
'Authorization' : 'Bearer '+str(access_token),
}
topstreamsforgame_response = requests.get('https://api.twitch.tv/helix/streams?game_id=&#39;+str(topgames_df['id'][0])+'&first=25', headers=headers)
topstreamsforgame_response_json = json.loads(topstreamsforgame_response.text)
topstreamsforgame_data = topstreamsforgame_response_json['data']
topstreamsforgame_df = pd.DataFrame.from_dict(json_normalize(topstreamsforgame_data), orient='columns')
for i in range(1,19) :
headers = {
'Authorization' : 'Bearer '+str(access_token),
}
topstreamsforgame_response = requests.get('https://api.twitch.tv/helix/streams?game_id=&#39;+str(topgames_df['id'][i])+'&first=25', headers=headers)
topstreamsforgame_response_json = json.loads(topstreamsforgame_response.text)
topstreamsforgame_data = topstreamsforgame_response_json['data']
topstreamsforgame_df_temp = pd.DataFrame.from_dict(json_normalize(topstreamsforgame_data), orient='columns')
frames = [topstreamsforgame_df, topstreamsforgame_df_temp]
topstreamsforgame_df = pd.concat(frames, ignore_index=True)
# Now that the FOR loop is exited and we have all our data, we export it into a csv
export_topgames_csv = topgames_df.to_csv (r'<filepath>.csv', index = None, header=True) #Don't forget to add '.csv' at the end of the path
export_topstreamsforgame_csv = topstreamsforgame_df.to_csv (r'<filepath>.csv', index = None, header=True)
# Our function is defined and it overwrites the CSV every 60 seconds. Now, we call it.
twitch()

As you can see, I have exported the csv within the function. So, it updates automatically every 60 seconds. Now, we have to connect it to Tableau and make our Dashboard.

5. Creating the Dashboard on Tableau

Open Tableau and connect the csv file for Top Games. Pull the Top Streams csv and create an inner join on ‘Id = Game Id”. Ensure that you have a live connection with the data source.

Now that the connection is made, go over to sheet 1. Pull the Viewer Count from the Measures into the Sheet and pull the Name into the Rows section. Make it a bar chart and order it.

Make another Sheet for top Streamers.

For the Dashboard, pull in both the sheets. And set the Games Sheet as a filter for the Streamers sheet. This will show you overall Top Streamers and game-wise Top Streamers.

This is our final dashboard. After this, I formatted it to make it look prettier and match Twitch’s design guide.
Set background to black i.e. HEX #000000 and the bar colors to Twitch purple i.e. HEX #6441a5

Remember, our data is updating live so we need to set the dashboard to auto-refresh every 60 seconds or refresh it manually.

6. Setting auto-refresh

I set the auto-refresh to update the dashboard every 60 seconds. This can be done using an auto-refresh algorithm or something like an AutoHotkey. Use Cmd+R to refresh the data source on mac and F5 on Windows. I have attached a file for auto refresh on Windows.

That’s it. Hope this was helpful. Please get in touch if you have any recommendations or doubts. Thanks for reading through!

References:
[1] https://www.businessofapps.com/data/twitch-statistics/