Twitch is the world’s largest live streaming platform focused primarily towards gamers and e-sports. With an average of 15 million unique daily viewers, the world spent a whopping 560 billion minutes watching content on Twitch in 2018. [1] We decided to see take a look at the Top Games and Top Streamers being watched on Twitch. This was made easy by Twitch as they provide a ton of developers tools including relevant data accessible through Twitch API.
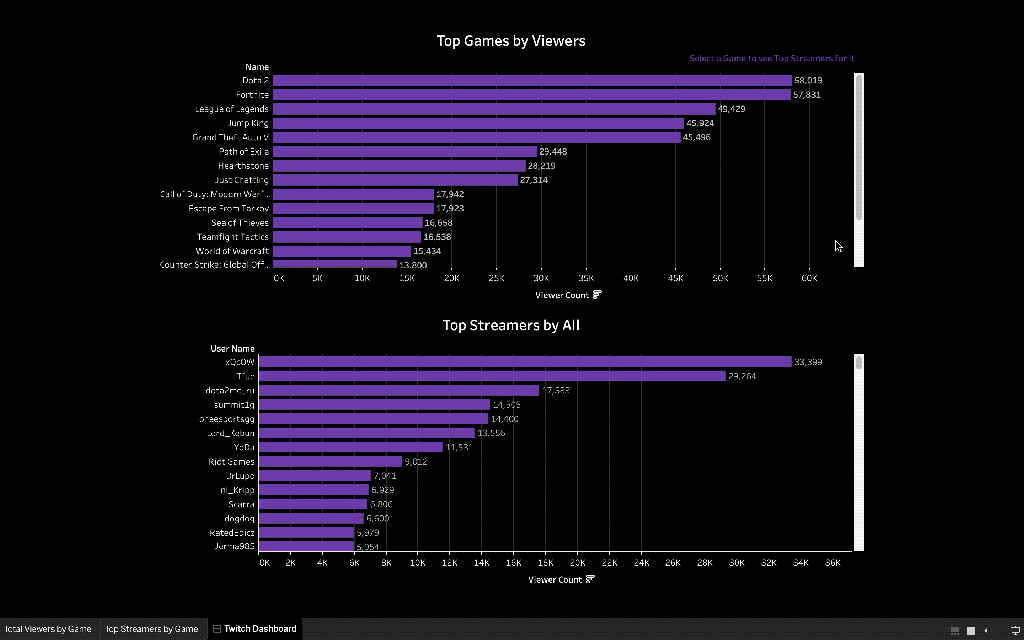
Here’s a pretty simple dashboard we created on Tableau
You can take a look at an interactive version published on my Tableau Public profile. This dashboard shows Top Games streamed and Top Streamers based on the number of Viewers. If you select a game then you can see the Top Streamers for a particular game. Tableau Public only takes data extracts so this public dashboard is not pulling live data from Twitch.
I have outlined a complete tutorial from accessing Twitch API using a python script to the final Tableau Dashboard design. (For our real-time dashboard we used an Amazon Web Services EC2 instance to run our python script and AWS RDS to store the live data. I am not going over those in this tutorial. Instead, I am using a locally stored csv file which my python script updates automatically every 60 seconds.)
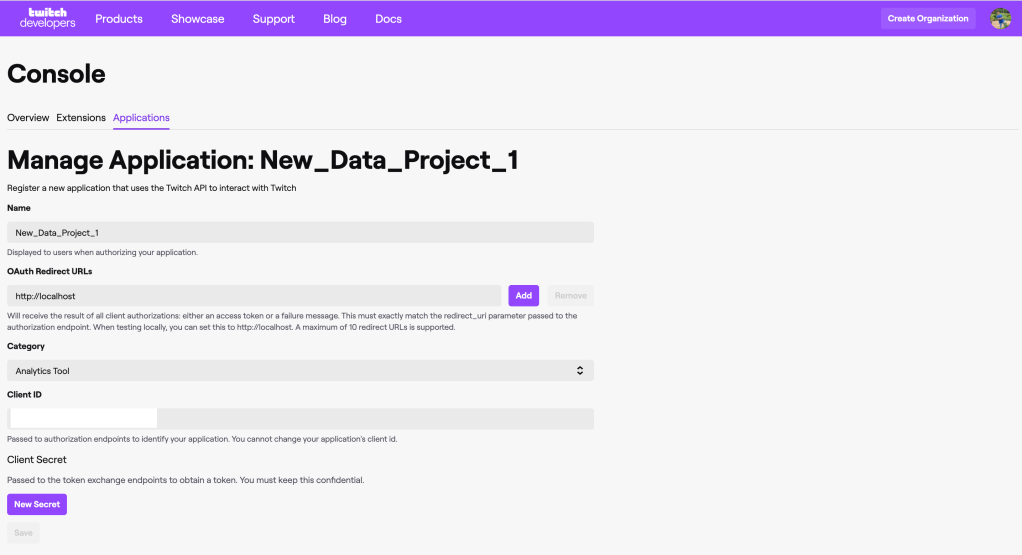
1. Create a Twitch Developer account at https://dev.twitch.tv/. Go to your Dashboard and ‘Register a New Application’. You will need this to get your Client ID and Client Secret.
Use localhost as redirect link. You will get your Client ID and Client Secret on this page.
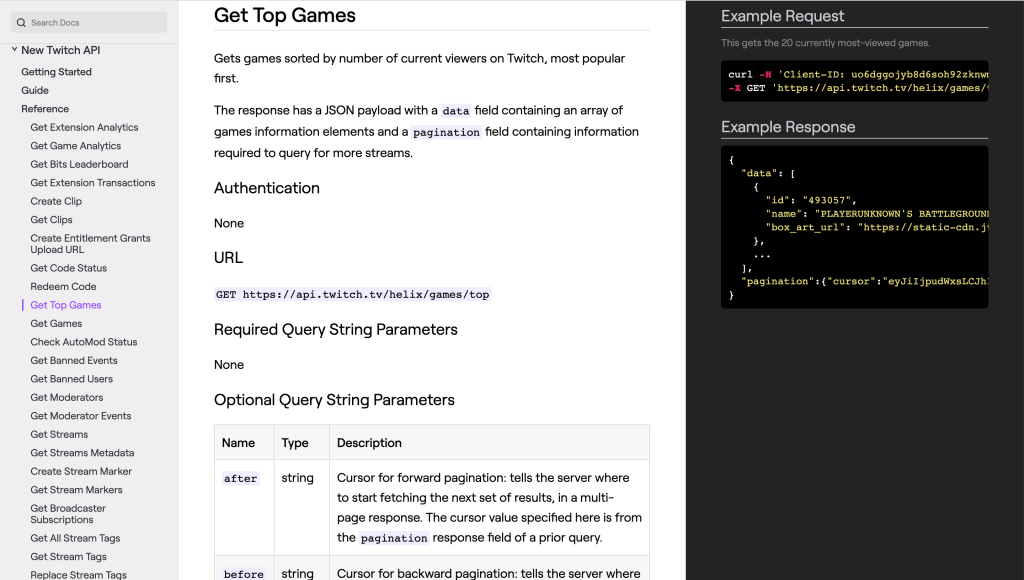
2. Check out the Twitch API documentation to fully understand the API calls, what data it offers, and what authentication it requires for the data you need.
3. Authenticating ourselves to getting the Access Token.
I used a Jupyter Notebook to write my python script. You can use whatever you are comfortable with. For beginners, I’d recommend Jupyter Notebooks. (do some research to see what best fits your skill level)
First begin by importing the necessary libraries
This file contains hidden or bidirectional Unicode text that may be interpreted or compiled differently than what appears below. To review, open the file in an editor that reveals hidden Unicode characters.
Learn more about bidirectional Unicode characters
Now move onto authentication to get the access token
This file contains hidden or bidirectional Unicode text that may be interpreted or compiled differently than what appears below. To review, open the file in an editor that reveals hidden Unicode characters.
Learn more about bidirectional Unicode characters
We will first access the API for Top 100 Games by number of viewers. Using the Game IDs for these games, we will get Stream data for them.
This file contains hidden or bidirectional Unicode text that may be interpreted or compiled differently than what appears below. To review, open the file in an editor that reveals hidden Unicode characters.
Learn more about bidirectional Unicode characters
To get the Top Streams for these games we will have to pass the game IDs as strings in the API call one at a time. For this, we need to create a FOR loop to get data for all the Games.
This file contains hidden or bidirectional Unicode text that may be interpreted or compiled differently than what appears below. To review, open the file in an editor that reveals hidden Unicode characters.
Learn more about bidirectional Unicode characters
Now, for the final trick, we will define a function which will enclose all our code and put a Timer so that it pulls the data every 60 seconds.
This file contains hidden or bidirectional Unicode text that may be interpreted or compiled differently than what appears below. To review, open the file in an editor that reveals hidden Unicode characters.
Learn more about bidirectional Unicode characters
As you can see, I have exported the csv within the function. So, it updates automatically every 60 seconds. Now, we have to connect it to Tableau and make our Dashboard.
5. Creating the Dashboard on Tableau
Open Tableau and connect the csv file for Top Games. Pull the Top Streams csv and create an inner join on ‘Id = Game Id”. Ensure that you have a live connection with the data source.
Now that the connection is made, go over to sheet 1. Pull the Viewer Count from the Measures into the Sheet and pull the Name into the Rows section. Make it a bar chart and order it.
Make another Sheet for top Streamers.
For the Dashboard, pull in both the sheets. And set the Games Sheet as a filter for the Streamers sheet. This will show you overall Top Streamers and game-wise Top Streamers.
This is our final dashboard. After this, I formatted it to make it look prettier and match Twitch’s design guide. Set background to black i.e. HEX #000000 and the bar colors to Twitch purple i.e. HEX #6441a5
Remember, our data is updating live so we need to set the dashboard to auto-refresh every 60 seconds or refresh it manually.
6. Setting auto-refresh
I set the auto-refresh to update the dashboard every 60 seconds. This can be done using an auto-refresh algorithm or something like an AutoHotkey. Use Cmd+R to refresh the data source on mac and F5 on Windows. I have attached a file for auto refresh on Windows.